Back when I was a teenager I learned a valuable lesson from my father that I kept with me through my career:
Never settle for untapped potential.
I can’t stress this enough, untapped potential freaks the shit out of me, I’m not only talking about personal potential but also businesses potential. With that as a guide I always tried to make sure that whatever project I’m working on, it should be enabling the people and business behind to use its full potential. And that is the kind of thought the made interested in Data Science.
Learning data science can be a pain for newcomers, and I believe the reason behind it is the lack of understanding the possibilities of using data science, for me that was a crucial turning point on passing the initial learning curve, understanding what value I could extract from it and how exactly I could use it.
My plan is for this article to be an initial kick off on a new series of articles I’m calling Unboxing Data Science, still deciding if I this is something I should invest the time into writing, so If you want to see it through let me know over twitter.
Getting started
I was working on an e-commerce and that was growing like crazy, revenue was going great but that was starting to raise some issues like, “How much money are we making next month” or “Should we prepare more inventory”, these are really important questions and put a business into reactive mode instead of a proactive mode.
That’s when I first decided to learn data science. Data science is all about prediction, you wanna try to build a model that will predict an outcome based on other data, so I decided that my first challenge would be to create a prediction model for the next month revenue.
The Stack
For this series, we will use Python, a Jupyter Notebook and a few libraries like panda, numpy and scikit-learn, we won’t use it all in this first article, but you will need to install Python 3 and Jupyter, an easy way to get all your environment ready is to download Anaconda, it will install all dependencies we need at once.
From Anaconda you can easily launch Jupyter and create your first notebook, I won’t dive into the details of that because it’s pretty straightforward and there are a ton of help online already.
The Data
Because of the stack we are going to use, the easiest way to consume data is in the form of a .csv file and that is exactly what I used, first I downloaded a dump and converted that into a .csv file.
As you learn data science you’ll realize that the key difference between building a great model is the data that you have and the new data you generate from it. That together with domain knowledge is key to build great models. In my case, I had all the data I need right in front of me, 3 years of orders histories right there in the e-commerce’s database, so I started poking it a bit first checking the number of orders by month.
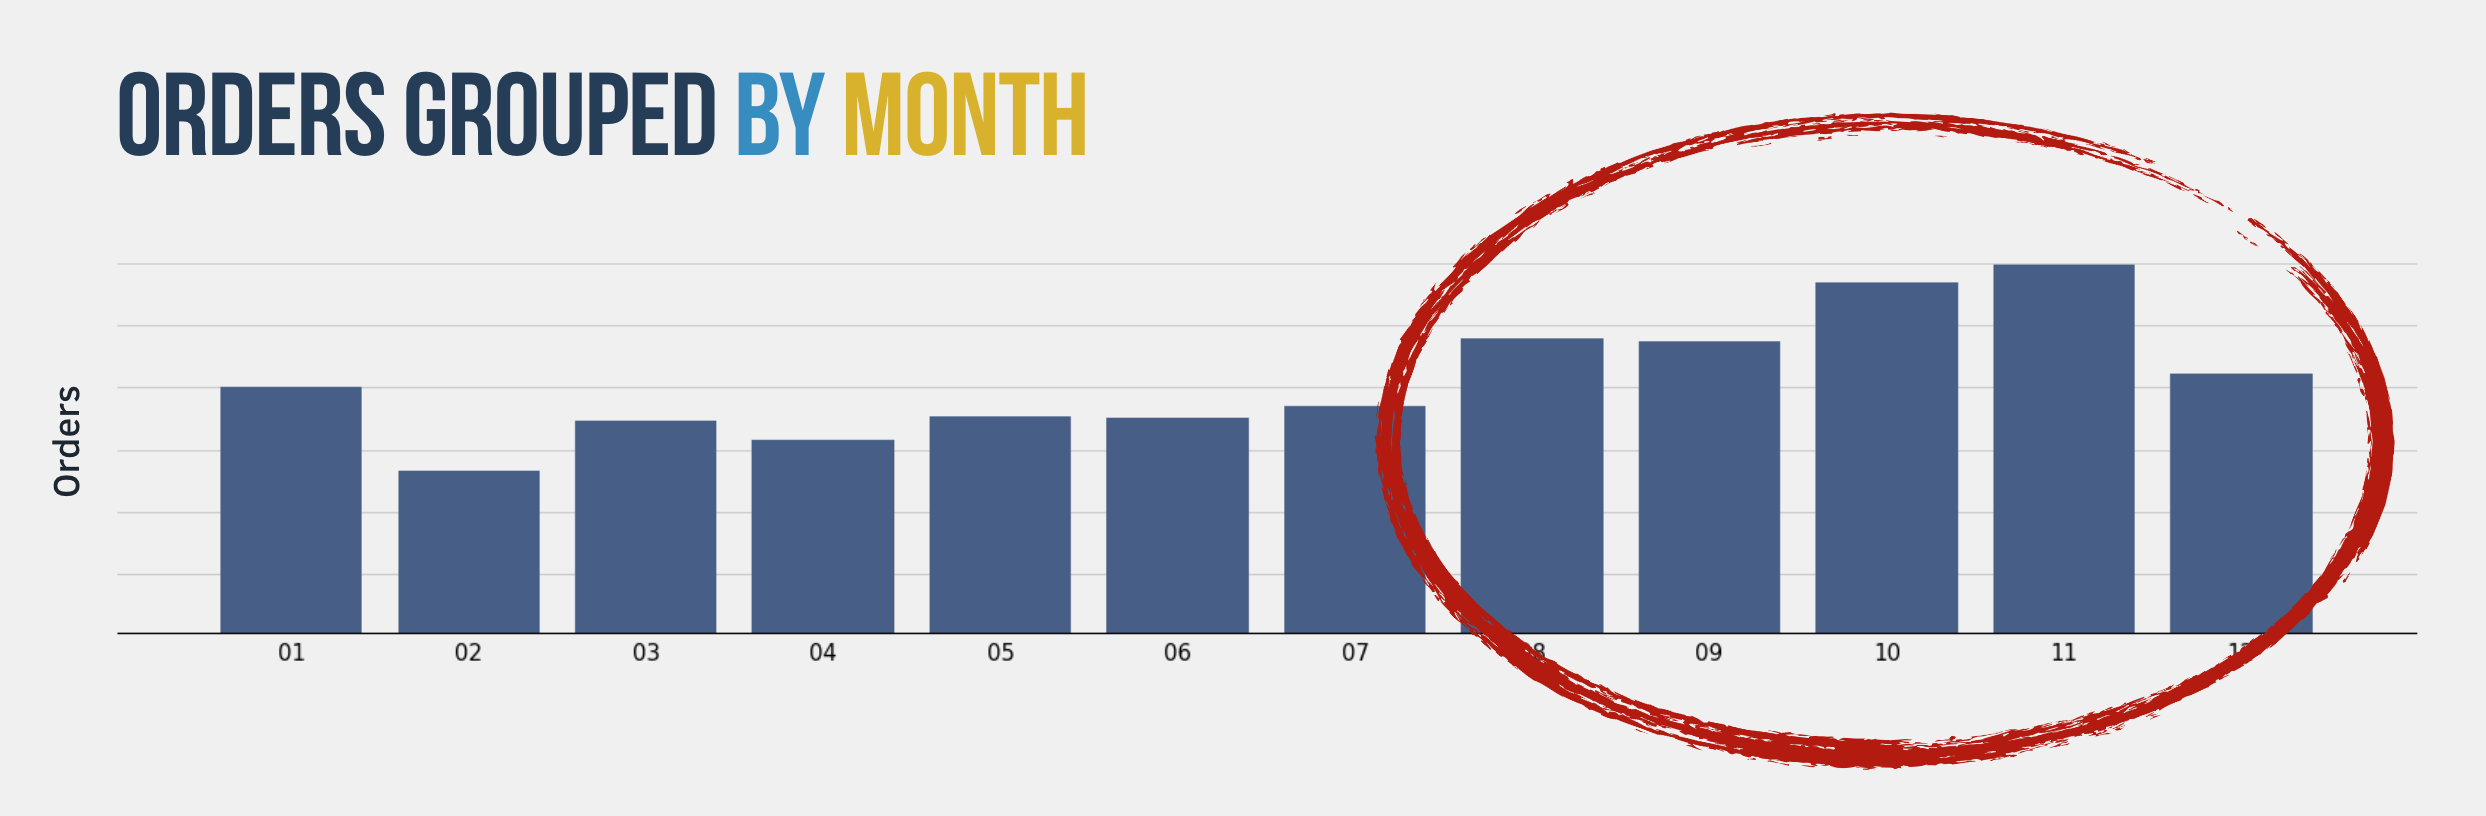
That’s when we start to see some patterns, it’s clear that the sales build up on the lasts months of the year, so we can definitely see how the month itself impact the revenue therefore that is something we need to take into account on our model.
We can also see this pattern by season:
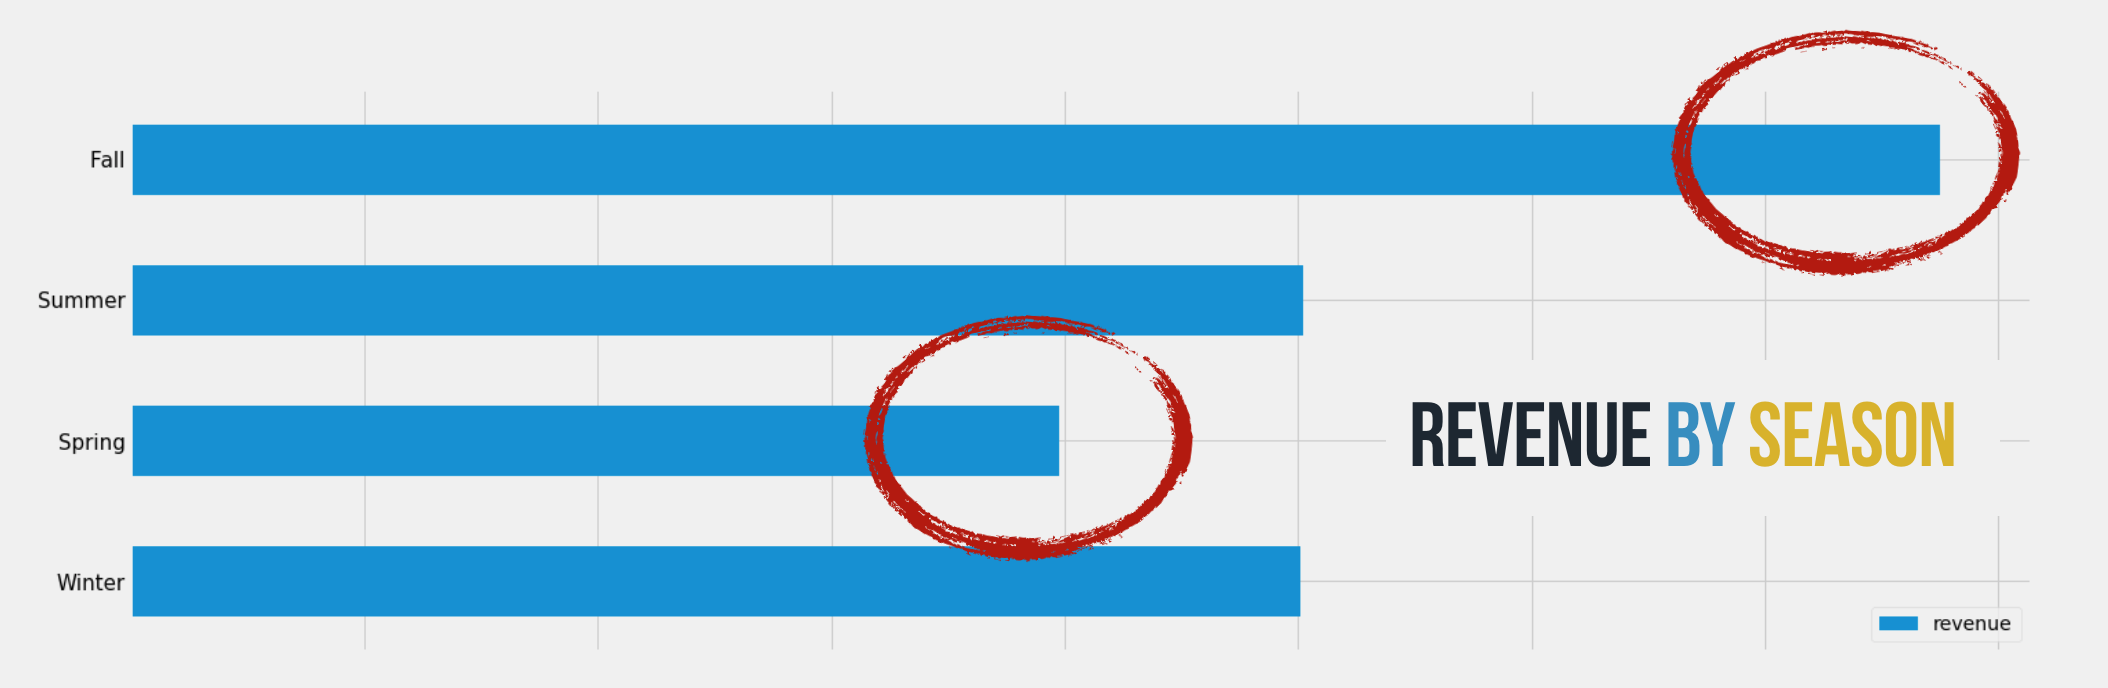
All that translates into data that we can use down the road when building our model. Another crucial component for me was to check if there is a trend for the revenue, that was key for me down the road as well:
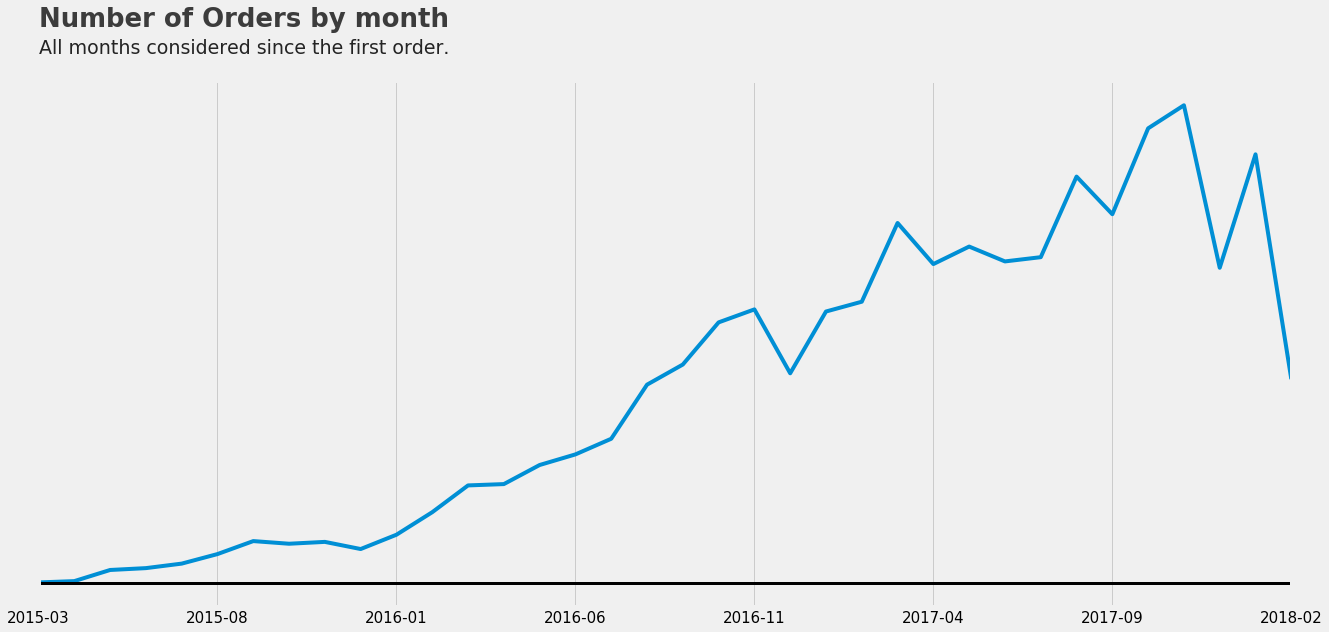
Here we can see how as the time goes by the sales tend to grow, and that makes measuring future revenue even more crucial for the business itself.
Next Steps
Wanna know more about how I solve this and get deeper into learning Data Science and Machine Learning? If you do, let me know, I’m trying to decide if this series is something I should invest my time in producing and getting feedback is crucial for me to take this decision, you can do that through my twitter.
If that gets enough traction I’ll write the next article now getting technical and showing how I not only built this initial charts but also the next steps I took after that.